
Chapter 6. Mixture Models
import os
import warnings

import arviz as az
import matplotlib.pyplot as plt
import pandas as pd
import seaborn as sns

import jax.numpy as jnp
from jax import random, vmap, local_device_count, pmap, lax, tree_map
from jax import nn as jnn
from jax.scipy import stats, special

import numpyro
import numpyro.distributions as dist
import numpyro.optim as optim

from numpyro.infer import MCMC, NUTS, HMC, Predictive
from numpyro.diagnostics import hpdi, print_summary
from numpyro.infer import Predictive, SVI, Trace_ELBO, init_to_value
from numpyro.infer.autoguide import AutoLaplaceApproximation
from numpyro.distributions.transforms import OrderedTransform

seed=1234

if "SVG" in os.environ:
    %config InlineBackend.figure_formats = ["svg"]
warnings.formatwarning = lambda message, category, *args, **kwargs: "{}: {}\n".format(
    category.__name__, message
)
az.style.use("arviz-darkgrid")
numpyro.set_platform("cpu") # or "gpu", "tpu" depending on system
numpyro.set_host_device_count(local_device_count())
# import pymc3 as pm
# import numpy as np
# import scipy.stats as stats
# import pandas as pd
# import theano.tensor as tt
# import matplotlib.pyplot as plt
# import arviz as az
# az.style.use('arviz-darkgrid')
# np.random.seed(42)
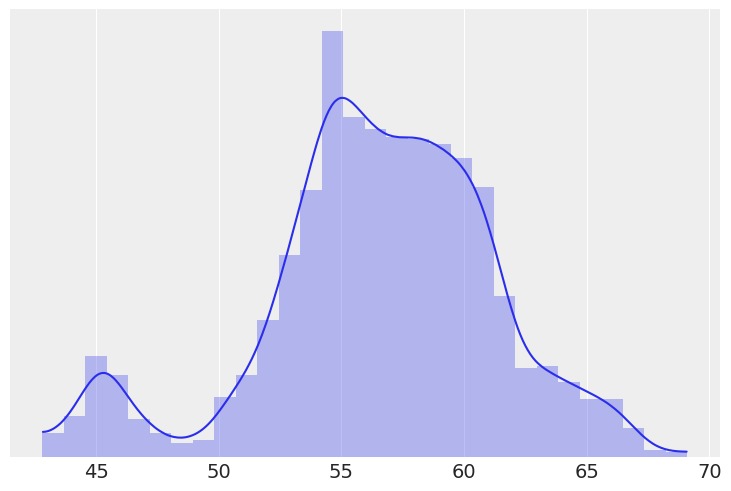
cs = pd.read_csv('../data/chemical_shifts_theo_exp.csv')
cs_exp = cs['exp']
az.plot_kde(cs_exp)
plt.hist(cs_exp, density=True, bins=30, alpha=0.3)
plt.yticks([])
([], [])
#with pm.Model() as model_kg:
#    p = pm.Dirichlet('p', a=np.ones(clusters))
#    z = pm.Categorical('z', p=p, shape=len(cs_exp))
#    means = pm.Normal('means', mu=cs_exp.mean(), sd=10, shape=clusters)
#    sd = pm.HalfNormal('sd', sd=10)
#
#    y = pm.Normal('y', mu=means[z], sd=sd, observed=cs_exp)
#    trace_kg = pm.sample()
# with numpyro.handlers.seed(rng_seed=seed):
#     N = 1  # Samples
#     b = numpyro.sample("p", dist.Dirichlet(concentration=jnp.ones(clusters)).expand([N]))
# # dist.Dirichlet(concentration=jnp.ones(clusters)).sample(random.PRNGKey(0), (1,))
# b.squeeze()
clusters = 2

def model(obs=None):
    p = numpyro.sample("p", dist.Dirichlet(concentration=jnp.ones(clusters)))
    c = dist.Categorical(probs=p.squeeze())

    means = numpyro.sample('means', dist.Normal(loc=cs_exp.mean(), scale=10), sample_shape=(clusters,))
    sd = numpyro.sample('sd', dist.HalfNormal(scale=10))
    component_dist = dist.Normal(loc=means, scale=sd)

    y = numpyro.sample('y', dist.MixtureSameFamily(mixing_distribution=c, component_distribution=component_dist), obs=obs)

kernel = NUTS(model)
mcmc = MCMC(kernel, num_warmup=500, num_samples=2000, num_chains=2, chain_method='sequential')
mcmc.run(random.PRNGKey(seed), obs=jnp.asarray(cs_exp))
sample: 100%|████████████████████████████████████████████| 2500/2500 [00:05<00:00, 491.61it/s, 3 steps of size 6.26e-01. acc. prob=0.92]
sample: 100%|███████████████████████████████████████████| 2500/2500 [00:01<00:00, 1701.92it/s, 7 steps of size 6.96e-01. acc. prob=0.90]
mcmc.get_samples()
{'means': DeviceArray([[46.59215 , 57.53969 ],
              [46.77208 , 57.60634 ],
              [47.404488, 57.47748 ],
              ...,
              [57.420513, 47.251415],
              [57.43893 , 47.13221 ],
              [57.534637, 46.69333 ]], dtype=float32),
 'p': DeviceArray([[0.07781173, 0.9221883 ],
              [0.07711639, 0.9228836 ],
              [0.11415413, 0.8858459 ],
              ...,
              [0.90347517, 0.09652483],
              [0.8928458 , 0.10715419],
              [0.9177794 , 0.08222061]], dtype=float32),
 'sd': DeviceArray([3.6385975, 3.6188638, 3.5631063, ..., 3.6311502, 3.6953619,
              3.5244987], dtype=float32)}
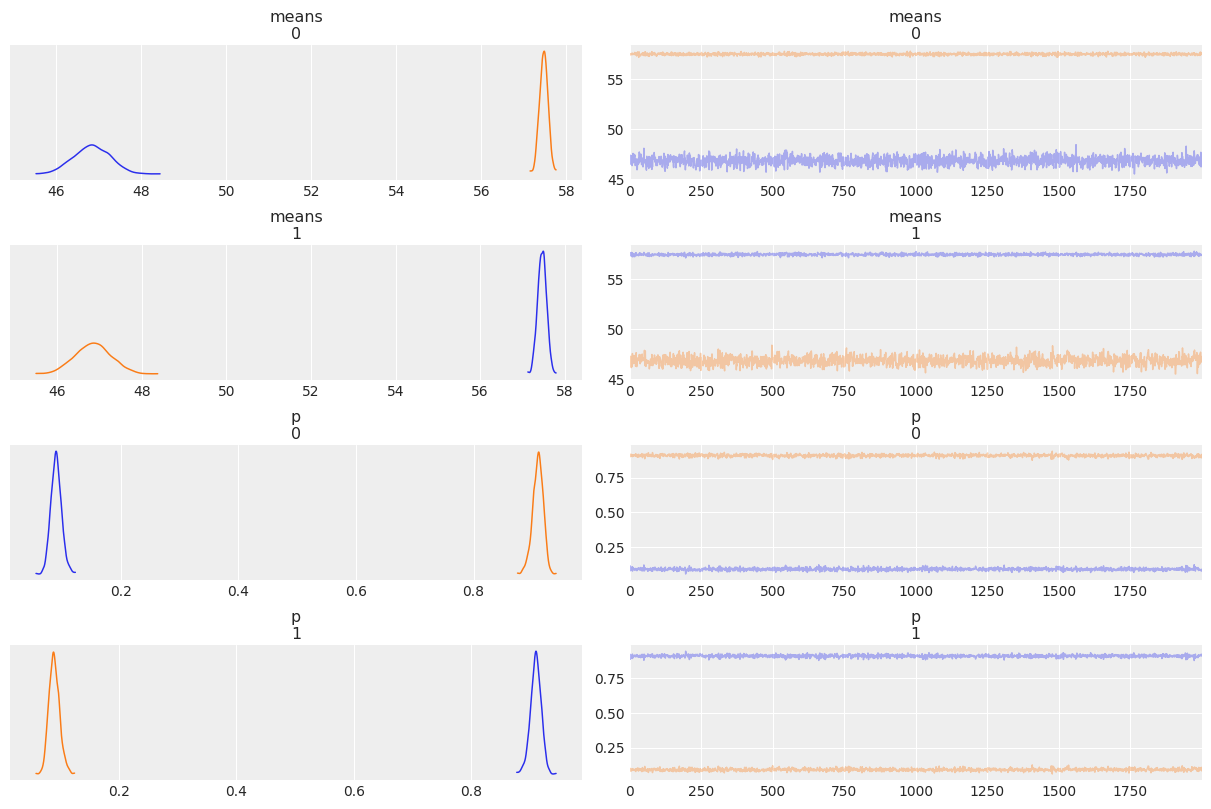
varnames = ['means', 'p']
az.plot_trace(mcmc, varnames, compact=False)
array([[<AxesSubplot:title={'center':'means\n0'}>,
        <AxesSubplot:title={'center':'means\n0'}>],
       [<AxesSubplot:title={'center':'means\n1'}>,
        <AxesSubplot:title={'center':'means\n1'}>],
       [<AxesSubplot:title={'center':'p\n0'}>,
        <AxesSubplot:title={'center':'p\n0'}>],
       [<AxesSubplot:title={'center':'p\n1'}>,
        <AxesSubplot:title={'center':'p\n1'}>]], dtype=object)
# clusters = 2
# with pm.Model() as model_mg:
#     p = pm.Dirichlet('p', a=np.ones(clusters))
#     means = pm.Normal('means', mu=cs_exp.mean(), sd=10, shape=clusters)
#     sd = pm.HalfNormal('sd', sd=10)
#     y = pm.NormalMixture('y', w=p, mu=means, sd=sd, observed=cs_exp)
#     trace_mg = pm.sample(random_seed=123)
# varnames = ['means', 'p']
# az.plot_trace(trace_mg, varnames)
# plt.savefig('B11197_06_06.png')
az.summary(mcmc, var_names=varnames)
| mean | sd | hdi_3% | hdi_97% | mcse_mean | mcse_sd | ess_bulk | ess_tail | r_hat | |
|---|---|---|---|---|---|---|---|---|---|
| means[0] | 52.154 | 5.324 | 46.283 | 57.672 | 3.752 | 3.176 | 3.0 | 55.0 | 1.83 |
| means[1] | 52.156 | 5.316 | 46.310 | 57.674 | 3.746 | 3.171 | 3.0 | 58.0 | 1.83 |
| p[0] | 0.500 | 0.410 | 0.078 | 0.924 | 0.289 | 0.245 | 3.0 | 51.0 | 1.83 |
| p[1] | 0.500 | 0.410 | 0.076 | 0.922 | 0.289 | 0.245 | 3.0 | 51.0 | 1.83 |
# az.summary(trace_mg, varnames)
Non-identifiability of mixture models
jnp.array([.9, 1]) * cs_exp.mean()
DeviceArray([50.859257, 56.51029 ], dtype=float32)
jnp.expand_dims(jnp.asarray(cs_exp), axis=1).shape
(1776, 1)
clusters = 2

def model(obs=None):
    p = numpyro.sample("p", dist.Dirichlet(concentration=jnp.ones(clusters)))
    c = dist.Categorical(probs=p.squeeze())

    mu = jnp.array([.9, 1]) * cs_exp.mean()

    means = numpyro.sample('means', dist.Normal(loc=mu, scale=10), sample_shape=(2,))
    sd = numpyro.sample('sd', dist.HalfNormal(scale=10))
    component_dist = dist.Normal(loc=means, scale=sd)

    y = numpyro.sample('y', dist.MixtureSameFamily(mixing_distribution=c, component_distribution=component_dist), obs=obs)

kernel = NUTS(model)
mcmc2 = MCMC(kernel, num_warmup=500, num_samples=2000, num_chains=2, chain_method='sequential')
mcmc2.run(random.PRNGKey(seed), obs=jnp.expand_dims(jnp.asarray(cs_exp), axis=1))
sample: 100%|████████████████████████████████████████████| 2500/2500 [00:06<00:00, 369.88it/s, 7 steps of size 6.35e-01. acc. prob=0.92]
sample: 100%|████████████████████████████████████████████| 2500/2500 [00:02<00:00, 835.65it/s, 3 steps of size 7.73e-01. acc. prob=0.86]
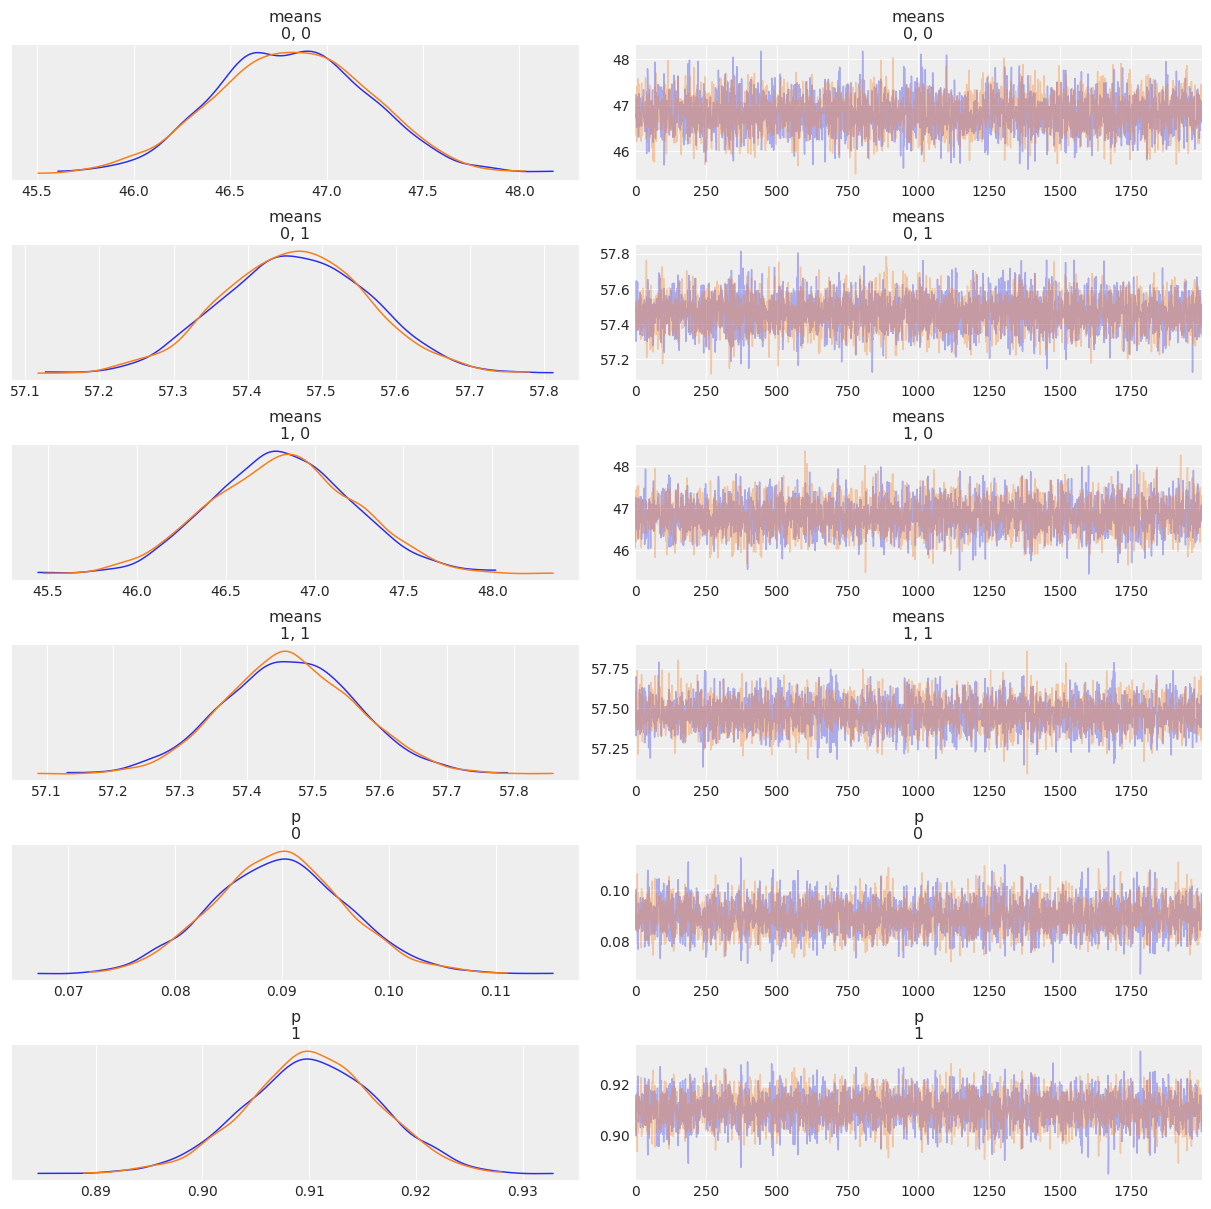
varnames = ['means', 'p']
az.plot_trace(mcmc2, varnames, compact=False)
array([[<AxesSubplot:title={'center':'means\n0, 0'}>,
        <AxesSubplot:title={'center':'means\n0, 0'}>],
       [<AxesSubplot:title={'center':'means\n0, 1'}>,
        <AxesSubplot:title={'center':'means\n0, 1'}>],
       [<AxesSubplot:title={'center':'means\n1, 0'}>,
        <AxesSubplot:title={'center':'means\n1, 0'}>],
       [<AxesSubplot:title={'center':'means\n1, 1'}>,
        <AxesSubplot:title={'center':'means\n1, 1'}>],
       [<AxesSubplot:title={'center':'p\n0'}>,
        <AxesSubplot:title={'center':'p\n0'}>],
       [<AxesSubplot:title={'center':'p\n1'}>,
        <AxesSubplot:title={'center':'p\n1'}>]], dtype=object)
# instead of a potential we can use an ordered transformation
# transform=pm.distributions.transforms.ordered
az.summary(mcmc2)
| mean | sd | hdi_3% | hdi_97% | mcse_mean | mcse_sd | ess_bulk | ess_tail | r_hat | |
|---|---|---|---|---|---|---|---|---|---|
| means[0,0] | 46.823 | 0.402 | 46.108 | 47.601 | 0.006 | 0.004 | 4707.0 | 3263.0 | 1.0 |
| means[0,1] | 57.464 | 0.099 | 57.274 | 57.646 | 0.001 | 0.001 | 5627.0 | 3227.0 | 1.0 |
| means[1,0] | 46.822 | 0.398 | 46.077 | 47.548 | 0.006 | 0.004 | 4401.0 | 2888.0 | 1.0 |
| means[1,1] | 57.464 | 0.099 | 57.280 | 57.649 | 0.001 | 0.001 | 4593.0 | 3082.0 | 1.0 |
| p[0] | 0.090 | 0.006 | 0.078 | 0.101 | 0.000 | 0.000 | 4095.0 | 2982.0 | 1.0 |
| p[1] | 0.910 | 0.006 | 0.899 | 0.922 | 0.000 | 0.000 | 4095.0 | 2982.0 | 1.0 |
| sd | 3.649 | 0.053 | 3.549 | 3.746 | 0.001 | 0.001 | 5568.0 | 3207.0 | 1.0 |
How to choose K
def model(obs=None):
    p = numpyro.sample("p", dist.Dirichlet(concentration=jnp.ones(clusters)))
    c = dist.Categorical(probs=p.squeeze())

    mu = jnp.array([.9, 1]) * cs_exp.mean()

    means = numpyro.sample('means', dist.Normal(loc=mu, scale=10), sample_shape=(2,))
    sd = numpyro.sample('sd', dist.HalfNormal(scale=10))
    component_dist = dist.Normal(loc=means, scale=sd)

    y = numpyro.sample('y', dist.MixtureSameFamily(mixing_distribution=c, component_distribution=component_dist), obs=obs)

kernel = NUTS(model)
mcmc2 = MCMC(kernel, num_warmup=500, num_samples=2000, num_chains=2, chain_method='sequential')
mcmc2.run(random.PRNGKey(seed), obs=jnp.expand_dims(jnp.asarray(cs_exp), axis=1))
sample: 100%|████████████████████████████████████████████| 2500/2500 [00:08<00:00, 281.81it/s, 7 steps of size 6.35e-01. acc. prob=0.92]
sample: 100%|████████████████████████████████████████████| 2500/2500 [00:05<00:00, 417.45it/s, 3 steps of size 7.73e-01. acc. prob=0.86]
clusters = [3, 4, 5, 6]

models = []
traces = []
for cluster in clusters:
    def model(obs=None):

        p = numpyro.sample("p", dist.Dirichlet(concentration=jnp.ones(cluster)))
        c = dist.Categorical(probs=p.squeeze())

        mu = jnp.linspace(cs_exp.min(), cs_exp.max(), cluster)
        means = numpyro.sample('means',
                               dist.TransformedDistribution(
                                   base_distribution=dist.Normal(loc=mu, scale=10).expand([cluster]),
                               transforms=OrderedTransform()
                              ))
        print(means)
        sd = numpyro.sample('sd', dist.HalfNormal(scale=10))
        component_dist = dist.Normal(loc=means, scale=sd)
        print(c.probs.shape)
        y = numpyro.sample('y', dist.MixtureSameFamily(mixing_distribution=c, component_distribution=component_dist), obs=obs)

    kernel = NUTS(model)
    trace = MCMC(kernel, num_warmup=500, num_samples=2000, num_chains=2, chain_method='sequential')
    trace.run(random.PRNGKey(seed), obs=jnp.expand_dims(jnp.asarray(cs_exp), axis=1))
    traces.append(trace)
    models.append(model)
[-1.405282   -1.0672494  -0.89249873]
(3,)
Traced<ConcreteArray([-1.405282   -1.0672494  -0.89249873], dtype=float32)>with<JVPTrace(level=2/0)>
  with primal = DeviceArray([-1.405282  , -1.0672494 , -0.89249873], dtype=float32)
       tangent = Traced<ShapedArray(float32[3]):JaxprTrace(level=1/0)>
(3,)
0%| | 0/2500 [00:00<?, ?it/s]
Traced<ShapedArray(float32[3])>with<JVPTrace(level=4/1)>
  with primal = Traced<ShapedArray(float32[3])>with<DynamicJaxprTrace(level=2/1)>
       tangent = Traced<ShapedArray(float32[3]):JaxprTrace(level=3/1)>
(3,)
sample: 100%|███████████████████████████████████████████| 2500/2500 [00:08<00:00, 286.52it/s, 63 steps of size 4.23e-02. acc. prob=0.90]
[-1.792481   -0.17571521  0.1223264 ]
(3,)
Traced<ConcreteArray([-1.792481   -0.17571521  0.1223264 ], dtype=float32)>with<JVPTrace(level=2/0)>
  with primal = DeviceArray([-1.792481  , -0.17571521,  0.1223264 ], dtype=float32)
       tangent = Traced<ShapedArray(float32[3]):JaxprTrace(level=1/0)>
(3,)
sample: 100%|███████████████████████████████████████████| 2500/2500 [00:03<00:00, 820.09it/s, 15 steps of size 2.43e-01. acc. prob=0.91]
[-1.405282   3.7530613  3.927812   4.386582 ]
(4,)
Traced<ConcreteArray([-1.405282   3.7530613  3.927812   4.386582 ], dtype=float32)>with<JVPTrace(level=2/0)>
  with primal = DeviceArray([-1.405282 ,  3.7530613,  3.927812 ,  4.386582 ], dtype=float32)
       tangent = Traced<ShapedArray(float32[4]):JaxprTrace(level=1/0)>
(4,)
0%| | 0/2500 [00:00<?, ?it/s]
Traced<ShapedArray(float32[4])>with<JVPTrace(level=4/1)>
  with primal = Traced<ShapedArray(float32[4])>with<DynamicJaxprTrace(level=2/1)>
       tangent = Traced<ShapedArray(float32[4]):JaxprTrace(level=3/1)>
(4,)
sample: 100%|███████████████████████████████████████████| 2500/2500 [00:35<00:00, 70.17it/s, 255 steps of size 1.19e-02. acc. prob=0.95]
[-1.792481  -0.5164275 -0.2183859  1.5443151]
(4,)
Traced<ConcreteArray([-1.792481  -0.5164275 -0.2183859  1.5443151], dtype=float32)>with<JVPTrace(level=2/0)>
  with primal = DeviceArray([-1.792481 , -0.5164275, -0.2183859,  1.5443151], dtype=float32)
       tangent = Traced<ShapedArray(float32[4]):JaxprTrace(level=1/0)>
(4,)
sample: 100%|███████████████████████████████████████████| 2500/2500 [00:27<00:00, 90.79it/s, 127 steps of size 8.03e-03. acc. prob=0.94]
[0.7935977 1.8328353 4.7855444 4.9249754 5.1354523]
(5,)
Traced<ConcreteArray([0.7935977 1.8328353 4.7855444 4.9249754 5.1354523], dtype=float32)>with<JVPTrace(level=2/0)>
  with primal = DeviceArray([0.7935977, 1.8328353, 4.7855444, 4.9249754, 5.1354523], dtype=float32)
       tangent = Traced<ShapedArray(float32[5]):JaxprTrace(level=1/0)>
(5,)
0%| | 0/2500 [00:00<?, ?it/s]
Traced<ShapedArray(float32[5])>with<JVPTrace(level=4/1)>
  with primal = Traced<ShapedArray(float32[5])>with<DynamicJaxprTrace(level=2/1)>
       tangent = Traced<ShapedArray(float32[5]):JaxprTrace(level=3/1)>
(5,)
sample: 100%|███████████████████████████████████████████| 2500/2500 [00:17<00:00, 145.12it/s, 31 steps of size 1.21e-01. acc. prob=0.95]
[ 0.9015174  4.3690042  7.8917313  8.105168  13.3667755]
(5,)
Traced<ConcreteArray([ 0.9015174  4.3690042  7.8917313  8.105168  13.3667755], dtype=float32)>with<JVPTrace(level=2/0)>
  with primal = DeviceArray([ 0.9015174,  4.3690042,  7.8917313,  8.105168 , 13.3667755],            dtype=float32)
       tangent = Traced<ShapedArray(float32[5]):JaxprTrace(level=1/0)>
(5,)
sample: 100%|███████████████████████████████████████████| 2500/2500 [00:13<00:00, 183.09it/s, 63 steps of size 6.52e-02. acc. prob=0.86]
[0.7935977 1.8328353 7.11053   7.249961  7.460438  8.691059 ]
(6,)
Traced<ConcreteArray([0.7935977 1.8328353 7.11053   7.249961  7.460438  8.691059 ], dtype=float32)>with<JVPTrace(level=2/0)>
  with primal = DeviceArray([0.7935977, 1.8328353, 7.11053  , 7.249961 , 7.460438 ,
                             8.691059 ], dtype=float32)
       tangent = Traced<ShapedArray(float32[6]):JaxprTrace(level=1/0)>
(6,)
0%| | 0/2500 [00:00<?, ?it/s]
Traced<ShapedArray(float32[6])>with<JVPTrace(level=4/1)>
  with primal = Traced<ShapedArray(float32[6])>with<DynamicJaxprTrace(level=2/1)>
       tangent = Traced<ShapedArray(float32[6]):JaxprTrace(level=3/1)>
(6,)
sample: 100%|███████████████████████████████████████████| 2500/2500 [00:35<00:00, 70.27it/s, 127 steps of size 6.11e-02. acc. prob=0.57]
[ 0.9015174  4.3690042  5.2567453  5.4701824 10.731791  10.875133 ]
(6,)
Traced<ConcreteArray([ 0.9015174  4.3690042  5.2567453  5.4701824 10.731791  10.875133 ], dtype=float32)>with<JVPTrace(level=2/0)>
  with primal = DeviceArray([ 0.9015174,  4.3690042,  5.2567453,  5.4701824, 10.731791 ,
                             10.875133 ], dtype=float32)
       tangent = Traced<ShapedArray(float32[6]):JaxprTrace(level=1/0)>
(6,)
sample: 100%|████████████████████████████████████████████| 2500/2500 [00:25<00:00, 97.44it/s, 31 steps of size 1.19e-01. acc. prob=0.92]
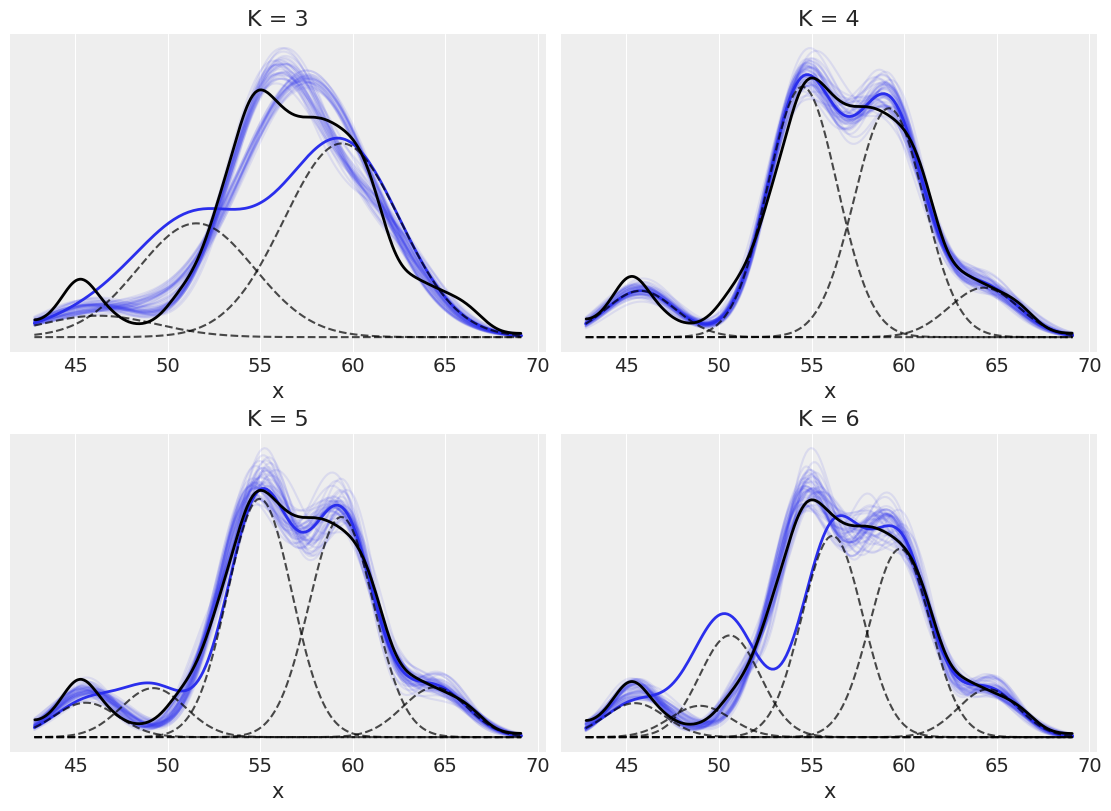
_, ax = plt.subplots(2, 2, figsize=(11, 8), constrained_layout=True)

ax = list(ax.flat)
x = jnp.linspace(cs_exp.min(), cs_exp.max(), 200)
for idx, trace_x in enumerate(traces):
    x_ = jnp.array([x] * clusters[idx]).T

    for i in range(50):
        i_ = int(dist.Uniform(low=0, high=len(trace_x.get_samples()['means'])).sample(key=random.PRNGKey(i)))
        means_y = trace_x.get_samples()['means'][i_]
        p_y = trace_x.get_samples()['p'][i_]
        sd = trace_x.get_samples()['sd'][i_]
        distri = dist.Normal(loc=means_y, scale=sd)
        ax[idx].plot(x, jnp.sum(jnp.exp(distri.log_prob(x_)) * p_y, 1), 'C0', alpha=0.1)

    means_y = trace_x.get_samples()['means'].mean(0)
    p_y = trace_x.get_samples()['p'].mean(0)
    sd = trace_x.get_samples()['sd'].mean()
    distri = dist.Normal(loc=means_y, scale=sd)
    #stats.norm(means_y, sd)
    ax[idx].plot(x, jnp.sum(jnp.exp(distri.log_prob(x_)) * p_y, 1), 'C0', lw=2)
    ax[idx].plot(x, jnp.exp(distri.log_prob(x_)) * p_y, 'k--', alpha=0.7)

    az.plot_kde(cs_exp, plot_kwargs={'linewidth':2, 'color':'k'}, ax=ax[idx])
    ax[idx].set_title('K = {}'.format(clusters[idx]))
    ax[idx].set_yticks([])
    ax[idx].set_xlabel('x')
# prior = Predictive(mcmc_l.sampler.model, num_samples=10)
# prior_p = prior(random.PRNGKey(seed), obs=y_1s)
Predictive(model=traces[0].sampler.model,
                     posterior_samples=traces[0].get_samples(),
                     return_sites=['y'])(random.PRNGKey(seed)).values()
Traced<ShapedArray(float32[3])>with<DynamicJaxprTrace(level=1/0)>
(3,)
dict_values([DeviceArray([57.74525 , 50.141926, 53.405487, ..., 57.63712 , 58.24072 ,
             64.50387 ], dtype=float32)])
ppc_mm = [
            Predictive(model=traces[i].sampler.model,
                     posterior_samples=traces[i].get_samples(),
                     return_sites=['y'])(random.PRNGKey(seed))
          for i in range(4)]
Traced<ShapedArray(float32[3])>with<DynamicJaxprTrace(level=1/0)>
(3,)
Traced<ShapedArray(float32[4])>with<DynamicJaxprTrace(level=1/0)>
(4,)
Traced<ShapedArray(float32[5])>with<DynamicJaxprTrace(level=1/0)>
(5,)
Traced<ShapedArray(float32[6])>with<DynamicJaxprTrace(level=1/0)>
(6,)
type(ppc_mm)
list
for idx, d_sim in enumerate(list(ppc_mm)):
    print(idx, d_sim['y'])
0 [57.74525  50.141926 53.405487 ... 57.63712  58.24072  64.50387 ]
1 [55.685463 47.6005   49.555256 ... 57.849586 55.612312 61.546535]
2 [54.532833 46.843277 54.844418 ... 54.875175 53.33296  59.637592]
3 [55.4144   41.105106 53.29952  ... 53.94297  52.922012 60.480656]
jnp.expand_dims(d_sim['y'][:100].T, axis=1).shape
(100, 1)
# iqr(d_sim['y'][:100].T, 0)
# ppc_mm = [pm.sample_posterior_predictive(traces[i], 1000, models[i])
#           for i in range(4)]
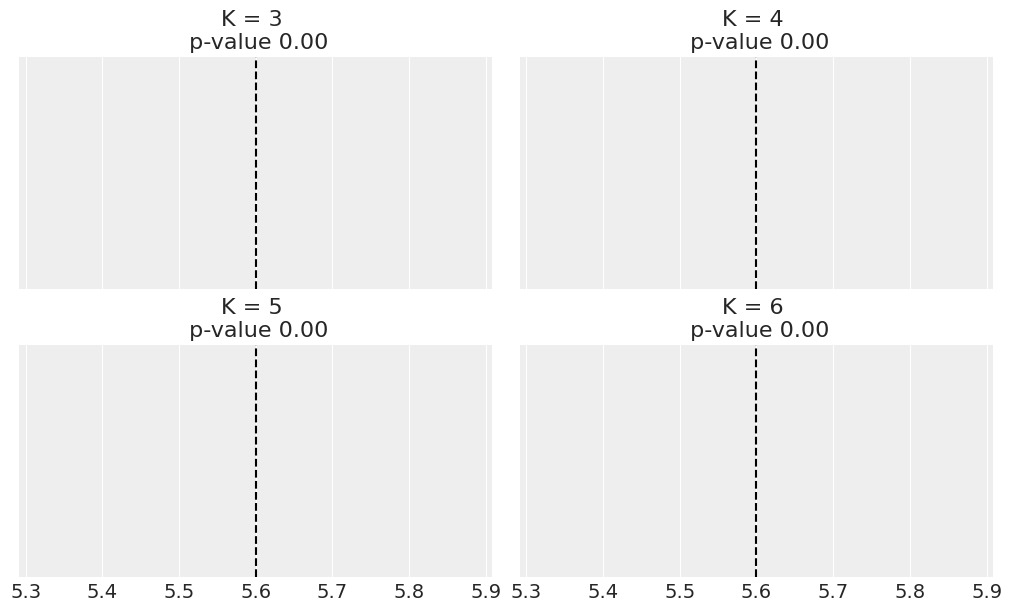
fig, ax = plt.subplots(2, 2, figsize=(10, 6), sharex=True, constrained_layout=True)
ax = list(ax.flat)
def iqr(x, a=0):
    return jnp.subtract(*jnp.percentile(jnp.asarray(x), [75, 25], axis=a))

T_obs = iqr(cs_exp)
for idx, d_sim in enumerate(ppc_mm):
    ds = jnp.expand_dims(d_sim['y'][:100], axis=1)
    T_sim = iqr(ds.T, 0)
    print(T_sim)
    p_value = jnp.mean(T_sim >= T_obs)
    az.plot_kde(T_sim, ax=ax[idx])
    ax[idx].axvline(T_obs, 0, 1, color='k', ls='--')
    ax[idx].set_title(f'K = {clusters[idx]} \n p-value {p_value:.2f}')
    ax[idx].set_yticks([])
[0. 0. 0. 0. 0. 0. 0. 0. 0. 0. 0. 0. 0. 0. 0. 0. 0. 0. 0. 0. 0. 0. 0. 0.
 0. 0. 0. 0. 0. 0. 0. 0. 0. 0. 0. 0. 0. 0. 0. 0. 0. 0. 0. 0. 0. 0. 0. 0.
 0. 0. 0. 0. 0. 0. 0. 0. 0. 0. 0. 0. 0. 0. 0. 0. 0. 0. 0. 0. 0. 0. 0. 0.
 0. 0. 0. 0. 0. 0. 0. 0. 0. 0. 0. 0. 0. 0. 0. 0. 0. 0. 0. 0. 0. 0. 0. 0.
 0. 0. 0. 0.]
RuntimeWarning: divide by zero encountered in true_divide
RuntimeWarning: invalid value encountered in true_divide
RuntimeWarning: divide by zero encountered in true_divide
RuntimeWarning: invalid value encountered in true_divide
RuntimeWarning: divide by zero encountered in true_divide
RuntimeWarning: invalid value encountered in true_divide
RuntimeWarning: divide by zero encountered in true_divide
RuntimeWarning: invalid value encountered in true_divide
comp = az.compare(dict(zip(clusters, traces)), ic="waic", method='BB-pseudo-BMA')
comp
UserWarning: The default method used to estimate the weights for each model,has changed from BB-pseudo-BMA to stacking
[5.2118061e+01 7.1559749e+20 8.0297345e+20 8.2045797e+20 2.1260502e+32
 1.1329012e+34]
(6,)
Traced<ShapedArray(float32[3])>with<DynamicJaxprTrace(level=1/0)>
(3,)
[5.2118061e+01 7.1559749e+20 8.0297345e+20 8.2045797e+20 2.1260502e+32
 1.1329012e+34]
(6,)
Traced<ShapedArray(float32[4])>with<DynamicJaxprTrace(level=1/0)>
(4,)
[5.2118061e+01 7.1559749e+20 8.0297345e+20 8.2045797e+20 2.1260502e+32
 1.1329012e+34]
(6,)
Traced<ShapedArray(float32[5])>with<DynamicJaxprTrace(level=1/0)>
(5,)
[5.2118061e+01 7.1559749e+20 8.0297345e+20 8.2045797e+20 2.1260502e+32
 1.1329012e+34]
(6,)
Traced<ShapedArray(float32[6])>with<DynamicJaxprTrace(level=1/0)>
(6,)
UserWarning: For one or more samples the posterior variance of the log predictive densities exceeds 0.4. This could be indication of WAIC starting to fail.
See http://arxiv.org/abs/1507.04544 for details
| rank | waic | p_waic | d_waic | weight | se | dse | warning | waic_scale | |
|---|---|---|---|---|---|---|---|---|---|
| 6 | 0 | -5135.310869 | 15.798141 | 0.000000 | 7.039205e-01 | 32.746687 | 0.000000 | True | log |
| 5 | 1 | -5136.615405 | 12.786784 | 1.304536 | 2.390853e-01 | 31.524217 | 1.300529 | False | log |
| 4 | 2 | -5139.413207 | 7.432724 | 4.102338 | 5.699420e-02 | 31.128302 | 2.552043 | False | log |
| 3 | 3 | -5203.690167 | 17.401520 | 68.379299 | 2.699810e-21 | 31.289554 | 9.751138 | False | log |
# Broken. TODO, fix error relating to this.
# az.plot_compare(comp)
Non-finite mixture model
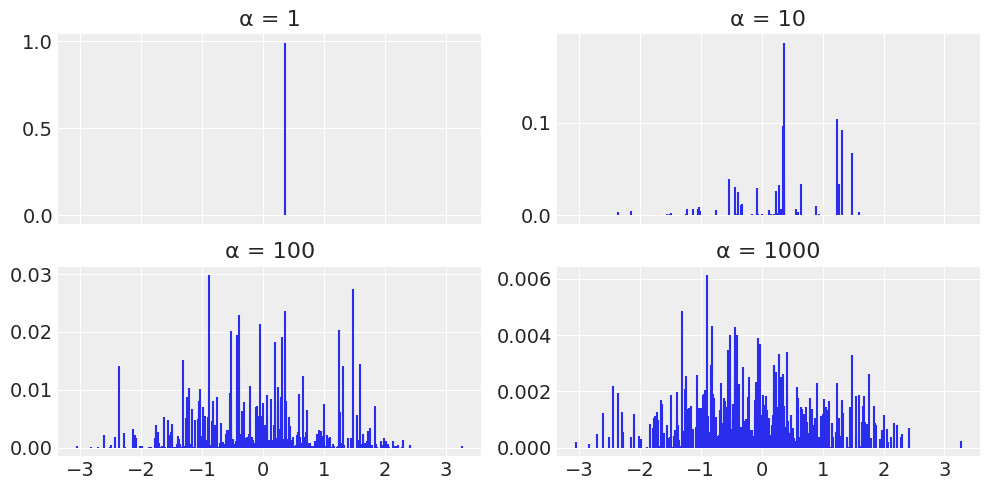
def stick_breaking_truncated(α, H, K):
    """
    Truncated stick-breaking process view of a DP

    Parameters
    ----------
    α : float
        concentration parameter
    H : `numpyro` distribution
        base distribution
    K : int
        number of components

    Returns
    -------
    locs : array
        locations
    w : array
        probabilities
    """

#     βs = stats.beta.rvs(1, α, size=K)
    βs = dist.Beta(concentration1=1, concentration0=α).sample(random.PRNGKey(1), (K,))
    w = jnp.empty(K)
    w = βs * jnp.concatenate((jnp.array([1.]), jnp.cumprod(1 - βs[:-1])))
    locs = H.sample(random.PRNGKey(1), (K,))
    return locs, w

# Parameters DP
K = 500
H = dist.Normal()
alphas = [1, 10, 100, 1000]

# plot
_, ax = plt.subplots(2, 2, sharex=True, figsize=(10, 5))
ax = list(ax.flat)
for idx, α in enumerate(alphas):
    locs, w = stick_breaking_truncated(α, H, K)
    ax[idx].vlines(locs, 0, w, color='C0')
    ax[idx].set_title('α = {}'.format(α))

plt.tight_layout()
UserWarning: This figure was using constrained_layout, but that is incompatible with subplots_adjust and/or tight_layout; disabling constrained_layout.
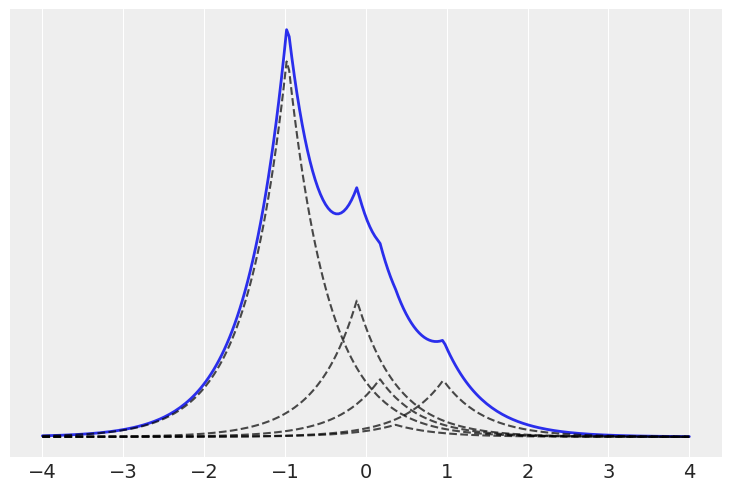
α = 10
H = dist.Normal()
K = 5

x = jnp.linspace(-4, 4, 250)
x_ = jnp.array([x] * K).T
locs, w = stick_breaking_truncated(α, H, K)

# dist = stats.laplace(locs, 0.5)
distri = dist.Laplace(loc=locs, scale=0.5)
plt.plot(x, jnp.sum(jnp.exp(distri.log_prob(x_)) * w, 1), 'C0', lw=2)
plt.plot(x, jnp.exp(distri.log_prob(x_)) * w, 'k--', alpha=0.7)
plt.yticks([])
([], [])
K = 20

def stick_breaking(α, K):
    β = numpyro.sample('β', dist.Beta(concentration1=1., concentration0=α), sample_shape=(K,))
    w = β * jnp.concatenate([jnp.array([1.]), jnp.cumprod(1. - β)[:-1]])
#     β = pm.Beta('β', 1., α, shape=K)
#     w = β * pm.math.concatenate([[1.], tt.extra_ops.cumprod(1. - β)[:-1]])

    return w
def model(obs=None):
    α = numpyro.sample('α', dist.Gamma(concentration=1, rate=1.))
    w = numpyro.deterministic('w', stick_breaking(α, K))

#     p = numpyro.sample("p", dist.Dirichlet(concentration=jnp.ones(clusters)))
    c = dist.Categorical(probs=w.squeeze())

    mu = jnp.linspace(cs_exp.min(), cs_exp.max(), K)

    means = numpyro.sample('means', dist.Normal(loc=mu, scale=10), sample_shape=(K,))

    sd = numpyro.sample('sd', dist.HalfNormal(scale=10))

    component_dist = dist.Normal(loc=means, scale=sd)

    obss = numpyro.sample('obss', dist.MixtureSameFamily(mixing_distribution=c, component_distribution=component_dist), obs=obs)

kernel = NUTS(model, target_accept_prob=0.85)
mcmc3 = MCMC(kernel, num_warmup=50, num_samples=50, num_chains=2, chain_method='sequential')
mcmc3.run(random.PRNGKey(seed), obs=jnp.expand_dims(jnp.asarray(cs_exp.values), axis=1))
sample: 100%|████████████████████████████████████████████| 100/100 [04:19<00:00,  2.60s/it, 1023 steps of size 6.57e-03. acc. prob=0.52]
sample: 100%|████████████████████████████████████████████| 100/100 [04:46<00:00,  2.86s/it, 1023 steps of size 1.83e-03. acc. prob=0.97]
# with pm.Model() as model:
#     α = pm.Gamma('α', 1, 1.)
#     w = pm.Deterministic('w', stick_breaking(α, K))
#     means = pm.Normal('means',
#                       mu=np.linspace(cs_exp.min(), cs_exp.max(), K),
#                       sd=10, shape=K)

#     sd = pm.HalfNormal('sd', sd=10, shape=K)
#     obs = pm.NormalMixture('obs', w, means, sd=sd, observed=cs_exp.values)
#     trace = pm.sample(1000, tune=2000, nuts_kwargs={'target_accept':0.85})
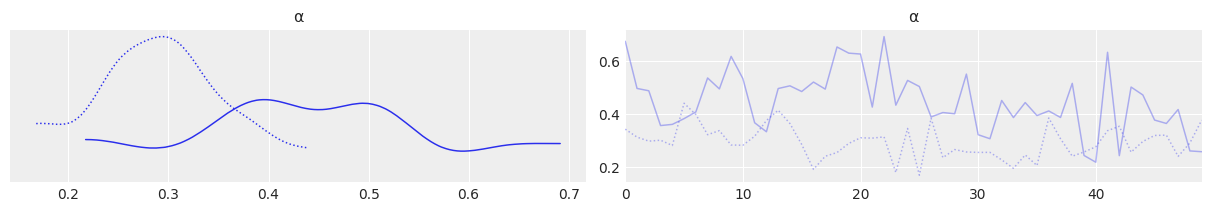
az.plot_trace(mcmc3, var_names=['α'], divergences=False, compact=False);
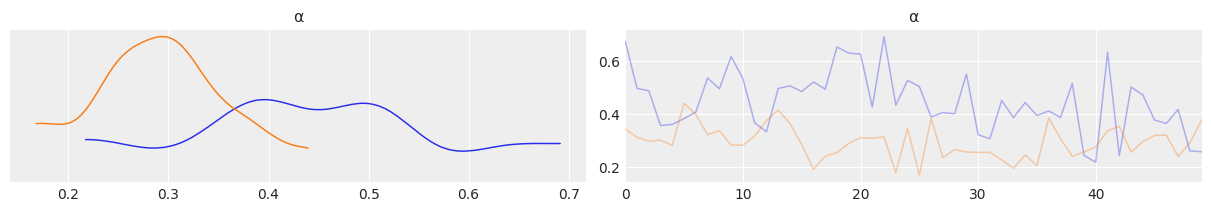
az.plot_trace(mcmc3, var_names=['α'], divergences=False);
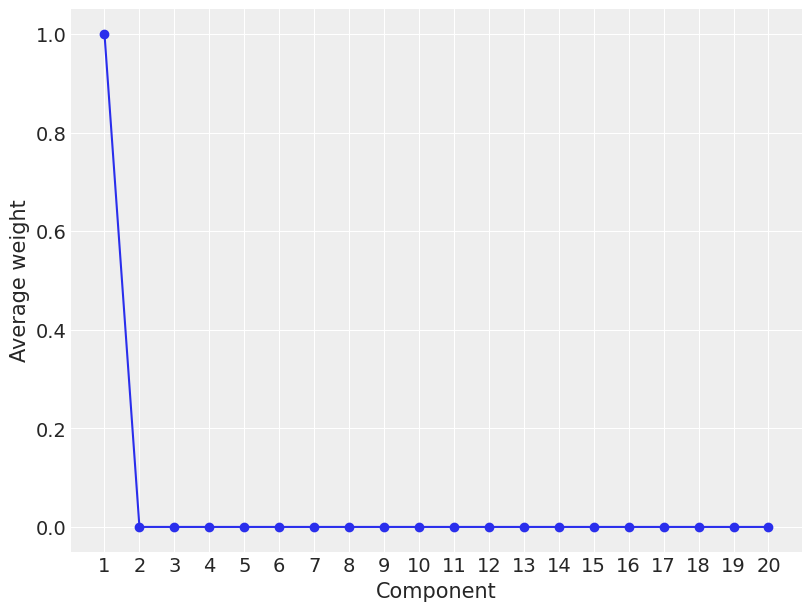
plt.figure(figsize=(8, 6))
plot_w = jnp.arange(K)
plt.plot(plot_w, mcmc3.get_samples()['w'].mean(0), 'o-')
plt.xticks(plot_w, plot_w+1)
plt.xlabel('Component')
plt.ylabel('Average weight')
Text(0, 0.5, 'Average weight')
trace.get_samples()['means']
DeviceArray([[45.43555 , 45.76748 , 45.818993, 54.50315 , 59.173943,
              64.33026 ],
             [45.743027, 45.879845, 46.071526, 54.450314, 59.080513,
              64.30733 ],
             [45.39138 , 45.724678, 45.91162 , 54.48335 , 59.17437 ,
              64.41409 ],
             ...,
             [45.498985, 51.297474, 54.39981 , 57.54888 , 60.524788,
              64.93046 ],
             [45.635292, 51.222794, 54.21004 , 57.125477, 60.29111 ,
              64.93555 ],
             [45.34042 , 51.778076, 54.736847, 57.581596, 60.05674 ,
              64.63671 ]], dtype=float32)
mcmc3.get_samples()['means'].shape
(100, 20, 20)
jnp.expand_dims(mcmc3.get_samples()['means'], axis=0).shape
(1, 100, 20, 20)
mcmc3.get_samples()['means'][:, jnp.newaxis, :].shape
(100, 1, 20, 20)
mcmc3.get_samples()['sd'].shape, jnp.expand_dims(mcmc3.get_samples()['sd'], axis=1).shape
((100,), (100, 1))
mcmc3.get_samples()['w'][:, jnp.newaxis, :].shape, jnp.expand_dims(mcmc3.get_samples()['w'], axis=2).shape
((100, 1, 20), (100, 20, 1))
dist.Normal(
        loc=jnp.expand_dims(mcmc3.get_samples()['means'], axis=0),
        scale=jnp.expand_dims(mcmc3.get_samples()['sd'], axis=0)
    )
---------------------------------------------------------------------------
ValueError                                Traceback (most recent call last)
/var/folders/9y/6kx7fns90pn84gtycx7dyl680000gn/T/ipykernel_33006/463852275.py in <module>
----> 1 dist.Normal(
      2         loc=jnp.expand_dims(mcmc3.get_samples()['means'], axis=0),
      3         scale=jnp.expand_dims(mcmc3.get_samples()['sd'], axis=0)
      4     )

/usr/local/anaconda3/envs/bap-numpyro/lib/python3.8/site-packages/numpyro/distributions/distribution.py in __call__(cls, *args, **kwargs)
     92             if result is not None:
     93                 return result
---> 94         return super().__call__(*args, **kwargs)
     95
     96     @property

/usr/local/anaconda3/envs/bap-numpyro/lib/python3.8/site-packages/numpyro/distributions/continuous.py in __init__(self, loc, scale, validate_args)
   1238
   1239     def __init__(self, loc=0.0, scale=1.0, validate_args=None):
-> 1240         self.loc, self.scale = promote_shapes(loc, scale)
   1241         batch_shape = lax.broadcast_shapes(jnp.shape(loc), jnp.shape(scale))
   1242         super(Normal, self).__init__(

/usr/local/anaconda3/envs/bap-numpyro/lib/python3.8/site-packages/numpyro/distributions/util.py in promote_shapes(shape, *args)
    286     else:
    287         shapes = [jnp.shape(arg) for arg in args]
--> 288         num_dims = len(lax.broadcast_shapes(shape, *shapes))
    289         return [
    290             _reshape(arg, (1,) * (num_dims - len(s)) + s) if len(s) < num_dims else arg

/usr/local/anaconda3/envs/bap-numpyro/lib/python3.8/site-packages/jax/_src/util.py in wrapper(*args, **kwargs)
    193         return f(*args, **kwargs)
    194       else:
--> 195         return cached(config._trace_context(), *args, **kwargs)
    196
    197     wrapper.cache_clear = cached.cache_clear

/usr/local/anaconda3/envs/bap-numpyro/lib/python3.8/site-packages/jax/_src/util.py in cached(_, *args, **kwargs)
    186     @functools.lru_cache(max_size)
    187     def cached(_, *args, **kwargs):
--> 188       return f(*args, **kwargs)
    189
    190     @functools.wraps(f)

/usr/local/anaconda3/envs/bap-numpyro/lib/python3.8/site-packages/jax/_src/lax/lax.py in broadcast_shapes(*shapes)
     90   result_shape = _try_broadcast_shapes(shapes)
     91   if result_shape is None:
---> 92     raise ValueError("Incompatible shapes for broadcasting: {}"
     93                      .format(tuple(map(tuple, shapes))))
     94   return result_shape

ValueError: Incompatible shapes for broadcasting: ((1, 1, 1, 1), (1, 100, 20, 20), (1, 1, 1, 100))
x_plot = jnp.linspace(cs.exp.min()-1, cs.exp.max()+1, 200)

post_pdf_contribs = jnp.exp(
    dist.Normal(
        loc=jnp.expand_dims(mcmc3.get_samples()['means'], axis=0),
        scale=jnp.expand_dims(mcmc3.get_samples()['sd'], axis=0)
    ).log_prob(jnp.atleast_3d(x_plot))
    ) # [:, jnp.newaxis, :]
post_pdfs = (jnp.expand_dims(mcmc3.get_samples()['w'], axis=0) * post_pdf_contribs).sum(axis=-1)
---------------------------------------------------------------------------
ValueError                                Traceback (most recent call last)
/var/folders/9y/6kx7fns90pn84gtycx7dyl680000gn/T/ipykernel_33006/4200411102.py in <module>
      2
      3 post_pdf_contribs = jnp.exp(
----> 4     dist.Normal(
      5         loc=jnp.expand_dims(mcmc3.get_samples()['means'], axis=0),
      6         scale=jnp.expand_dims(mcmc3.get_samples()['sd'], axis=0)

/usr/local/anaconda3/envs/bap-numpyro/lib/python3.8/site-packages/numpyro/distributions/distribution.py in __call__(cls, *args, **kwargs)
     92             if result is not None:
     93                 return result
---> 94         return super().__call__(*args, **kwargs)
     95
     96     @property

/usr/local/anaconda3/envs/bap-numpyro/lib/python3.8/site-packages/numpyro/distributions/continuous.py in __init__(self, loc, scale, validate_args)
   1238
   1239     def __init__(self, loc=0.0, scale=1.0, validate_args=None):
-> 1240         self.loc, self.scale = promote_shapes(loc, scale)
   1241         batch_shape = lax.broadcast_shapes(jnp.shape(loc), jnp.shape(scale))
   1242         super(Normal, self).__init__(

/usr/local/anaconda3/envs/bap-numpyro/lib/python3.8/site-packages/numpyro/distributions/util.py in promote_shapes(shape, *args)
    286     else:
    287         shapes = [jnp.shape(arg) for arg in args]
--> 288         num_dims = len(lax.broadcast_shapes(shape, *shapes))
    289         return [
    290             _reshape(arg, (1,) * (num_dims - len(s)) + s) if len(s) < num_dims else arg

/usr/local/anaconda3/envs/bap-numpyro/lib/python3.8/site-packages/jax/_src/util.py in wrapper(*args, **kwargs)
    193         return f(*args, **kwargs)
    194       else:
--> 195         return cached(config._trace_context(), *args, **kwargs)
    196
    197     wrapper.cache_clear = cached.cache_clear

/usr/local/anaconda3/envs/bap-numpyro/lib/python3.8/site-packages/jax/_src/util.py in cached(_, *args, **kwargs)
    186     @functools.lru_cache(max_size)
    187     def cached(_, *args, **kwargs):
--> 188       return f(*args, **kwargs)
    189
    190     @functools.wraps(f)

/usr/local/anaconda3/envs/bap-numpyro/lib/python3.8/site-packages/jax/_src/lax/lax.py in broadcast_shapes(*shapes)
     90   result_shape = _try_broadcast_shapes(shapes)
     91   if result_shape is None:
---> 92     raise ValueError("Incompatible shapes for broadcasting: {}"
     93                      .format(tuple(map(tuple, shapes))))
     94   return result_shape

ValueError: Incompatible shapes for broadcasting: ((1, 1, 1, 1), (1, 100, 20, 20), (1, 1, 1, 100))
import numpy as np
x_plot = np.linspace(cs.exp.min()-1, cs.exp.max()+1, 200)
import scipy
post_pdf_contribs = scipy.stats.norm.pdf(np.atleast_3d(x_plot),
                                   mcmc3.get_samples()['means'][:, np.newaxis, :],
                                   mcmc3.get_samples()['sd'][:, np.newaxis, :])
post_pdfs = (mcmc3.get_samples()['w'][:, np.newaxis, :] * post_pdf_contribs).sum(axis=-1)
---------------------------------------------------------------------------
IndexError                                Traceback (most recent call last)
/var/folders/9y/6kx7fns90pn84gtycx7dyl680000gn/T/ipykernel_33006/2613252450.py in <module>
      4 post_pdf_contribs = scipy.stats.norm.pdf(np.atleast_3d(x_plot),
      5                                    mcmc3.get_samples()['means'][:, np.newaxis, :],
----> 6                                    mcmc3.get_samples()['sd'][:, np.newaxis, :])
      7 post_pdfs = (mcmc3.get_samples()['w'][:, np.newaxis, :] * post_pdf_contribs).sum(axis=-1)

/usr/local/anaconda3/envs/bap-numpyro/lib/python3.8/site-packages/jax/_src/numpy/lax_numpy.py in _rewriting_take(arr, idx, indices_are_sorted, unique_indices)
   5150   arr = asarray(arr)
   5151   treedef, static_idx, dynamic_idx = _split_index_for_jit(idx, arr.shape)
-> 5152   return _gather(arr, treedef, static_idx, dynamic_idx, indices_are_sorted,
   5153                  unique_indices)
   5154

/usr/local/anaconda3/envs/bap-numpyro/lib/python3.8/site-packages/jax/_src/numpy/lax_numpy.py in _gather(arr, treedef, static_idx, dynamic_idx, indices_are_sorted, unique_indices)
   5159             unique_indices):
   5160   idx = _merge_static_and_dynamic_indices(treedef, static_idx, dynamic_idx)
-> 5161   indexer = _index_to_gather(shape(arr), idx)  # shared with _scatter_update
   5162   y = arr
   5163

/usr/local/anaconda3/envs/bap-numpyro/lib/python3.8/site-packages/jax/_src/numpy/lax_numpy.py in _index_to_gather(x_shape, idx, normalize_indices)
   5251 def _index_to_gather(x_shape, idx, normalize_indices=True):
   5252   # Remove ellipses and add trailing slice(None)s.
-> 5253   idx = _canonicalize_tuple_index(len(x_shape), idx)
   5254
   5255   # Check for advanced indexing:

/usr/local/anaconda3/envs/bap-numpyro/lib/python3.8/site-packages/jax/_src/numpy/lax_numpy.py in _canonicalize_tuple_index(arr_ndim, idx)
   5531   if len_without_none > arr_ndim:
   5532     msg = "Too many indices for array: {} non-None/Ellipsis indices for dim {}."
-> 5533     raise IndexError(msg.format(len_without_none, arr_ndim))
   5534   ellipses = (i for i, elt in enumerate(idx) if elt is Ellipsis)
   5535   ellipsis_index = next(ellipses, None)

IndexError: Too many indices for array: 2 non-None/Ellipsis indices for dim 1.
plt.figure(figsize=(8, 6))

plt.hist(cs_exp.values, bins=25, density=True, alpha=0.5)
plt.plot(x_plot, post_pdfs[::100].T, c='0.5')
plt.plot(x_plot, post_pdfs.mean(axis=0), c='k')

plt.xlabel('x')
plt.yticks([])
## Exercises
# clusters = 3
# n_cluster = [200, 150, 170]
# n_total = sum(n_cluster)
# means = [5, 0, -3]
# std_devs = [2, 2, 2]
# mix = np.random.normal(jnp.repeat(means, n_cluster),
# np.repeat(std_devs, n_cluster))
# az.plot_kde(np.array(mix));